- Pin
- 🔥 Gate.io #Launchpool# Stake to Earn: Pi Network ( #PI# )
🗓 Subscription: 13:30 PM, February 16 — February 21 (UTC)
🏆 Rewards Distributed Hourly
💵 Total Reward: 1,000 #GT#
✨ Highest Estimated APR: 967.09%
👉 Stake Now: https://www.gate.io/launchpool/PI?pid=207
Details: https://www.gate.io/article/43365
- 🎉 Gate Post #ContentCreatorsChallenge# is Heating Up! Register Now and Post to Unlock Prizes Worth $3,000 Reward!
🌟 How to Join:
1️⃣ Click the link to visit event page 👉 https://www.gate.io/campaigns/402
2️⃣ Click the 'Join Now' button to register
3️⃣ Post and increase post interactions and numbers to qualify for rewards
📌 Post any crypto-related content to participate!
🎁 Win exciting prizes like Luban Lock, Cloisonné Enamel Painting, Tea Set, Futures Voucher, and More!
⏰ Event Ends at February 25, 16:00 PM (UTC)
Details: https://www.gate.io/announcements/article/43206
- 🔥 Gate.io Golden Snake Bringing Fortune
🎁 The Red Envelopes and Gold Bars Challenge is nearing its end!
💪 Don’t miss out, grab your share of $50,000 in rewards: https://www.gate.io/activities/goldensnake2025
🔸 Discover surprise red envelopes, instantly credited
🔸 New user perks—play and share for extra rewards
🔸 Log in now and use your free chances!
More: https://www.gate.io/announcements/article/43082
#GoldenSnake2025#
- 🚨 A New Chapter on the Track: Gate.io 🤝 Oracle Red Bull Racing
🏎💨 Gate.io has officially entered into a partnership with Oracle #Red Bull Racing# , becoming its exclusive cryptocurrency exchange partner!
💪 Together, we’ll ignite the upcoming season with #Web3# technology, bringing the speed and passion of the digital era to life!
More: https://www.gate.io/announcements/article/43196
- 🔥 Gate.io Launchpool: Solayer (LAYER) is Live!
Stake #LAYER# to Earn #LAYER# Airdrops
👉 Rewards Distributed Hourly
👉 High Est. APR: 486.62%
💎 Stake Now: https://www.gate.io/launchpool/LAYER?pid=200
🎁 New User Bonus: Register and Stake to Share $1,000 in #LAYER# !
More: https://www.gate.io/article/43256
#GateioLaunchpool# #Airdrop#
Bitcoin and Dogecoin price prediction: Crypto analysts evaluate the two leading cryptocurrencies!
With Bitcoin surpassing $90,000, cryptocurrencies started to recover on Thursday, November 14th. Altcoins rose with a positive market sentiment, while meme coins achieved stronger gains. Leading meme coin DOGE outperformed many high-market-cap altcoins and meme coins with a weekly gain of over 100%. As the market rally optimism continues, analyst Peter Brandt points out an important common point in the historical DOGE and BTC charts, while many analysts have shared their views on the rise.
Dogecoin and Bitcoin have more room to rise!
While the market has generally been rising, meme coins have provided the best returns in the past week, with DOGE increasing by over 100% weekly. With Elon Musk's growing influence in the crypto market, optimism on Dogecoin has increased even further, and the meme coin continues to strengthen with Musk's supportive messages.
Crypto analyst Kaleo expressed that Dogecoin is moving towards new all-time highs, stating that it is still in the early stages of a known bull market for the meme coin, and discussed the possibility of growth after the Bitcoin halving.
Source: X"200+ days after each BTC halving, DOGE has made rapid movements with large multiples. Even the timing between the previous ATHs and the start of each move had a similar cadence. The important thing is that if history rhymes with itself once again, there is still plenty of room to run. $1.00 soon"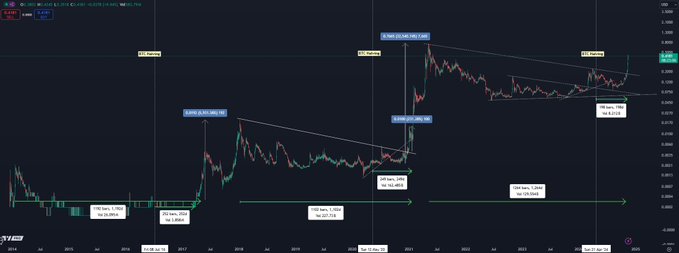
Analyst compared historical charts of Bitcoin and Doge
Along with political influences and Musk's support, DOGE, which has shown a significant increase in price along with Bitcoin, was addressed by Peter Brandt, who took a historical chart formation into account.
Cryptocurrency analyst shared in his latest post that the 2015-16 DOGE chart resembles the BTC chart. The meme coin, which entered a complex correction process with the completion of the top fall, falling wedge, and double bottom formation, shared that it has a similar BTC chart to May 2016.
Rising formation on Martinez Bitcoin chart
The Bitcoin price is trading at $91,461 at the time of writing this article. At the same time, the market value of the cryptocurrency, which tested a new all-time high of $93,434 in early trading hours, reached $1.81 trillion.
BTC cup and handle formation Source: Ali Martinez XKrypto analyst Ali Martinez pointed out that a cup and handle formation has formed in the current BTC chart, and stated that the next target for BTC could be $255,450. The cup and handle formation indicates a price increase after a slowing price movement.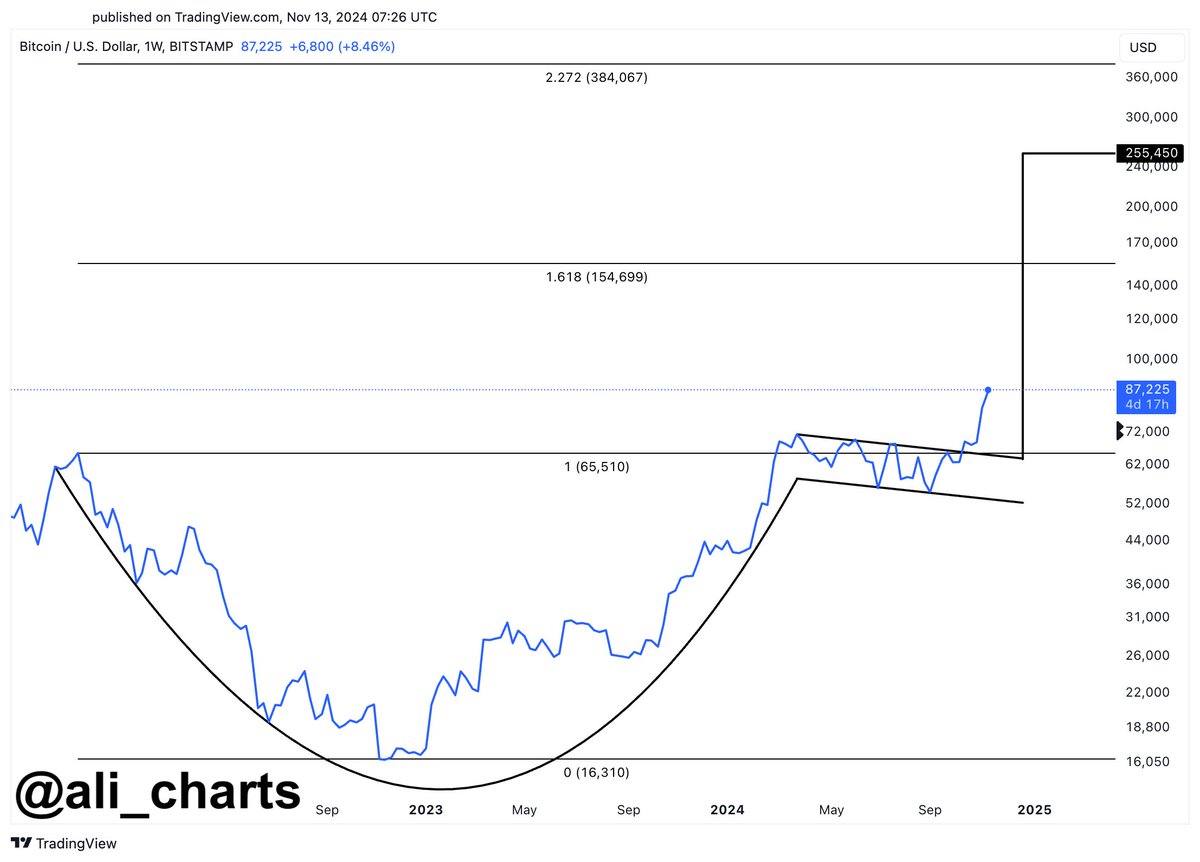
The Martinez cup and handle formation “The cup phase started in mid-2022 and ended in early 2023, with Bitcoin reaching a near-bottom of $15,000. This phase concluded with Bitcoin hitting a resistance level of $73,750 in early 2024, leading to a consolidation that formed the Cup.”.
The current support level that needs to be closely monitored is $90,000, and it is consolidating in this area. If BTC holds above this level, it can continue the trend towards the $100,000 target.
DOGE price outlook
The price of DOGE, the sixth largest cryptocurrency, is currently trading at $0.39 and has shown a 2.53% increase in the last 24 hours. The meme coin, which reached $0.43 in early trading hours and is 46% lower than its all-time high of $0.73, experienced a correction at the $0.41 resistance level.
DOGE current price chartAccording to Coinglass data, the OI ratio of the meme coin, which has reached a market value of 57 billion dollars, decreased by 2% and its volume decreased by 31% in the same period. However, the ADX index, which indicates the strength of the trend, continues to move upward. The RSI indicator is in the overbought zone at the level of 83. If the decline continues, attention should be paid to the levels of 0.38 dollars and 0.37 dollars.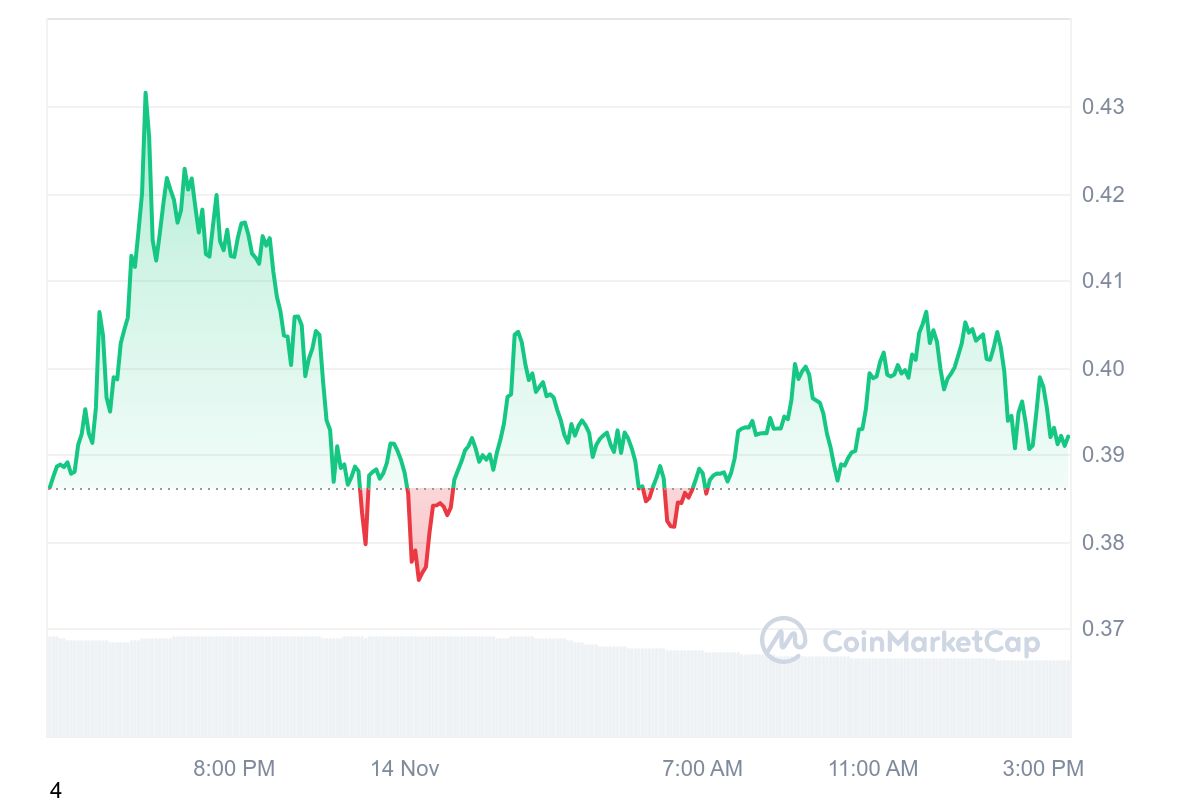
The information in the text is purely for informational purposes. It does not constitute any investment advice. Author and kriptoparahaber.com are not responsible for any profit or loss arising from your investments. Ultimately, investment is based on many factors such as knowledge, experience, research, and personal decisions.
Related News