- Topic
106k posts
65k posts
62k posts
57k posts
54k posts
47k posts
44k posts
44k posts
42k posts
- 10#NADA#
40k posts
- Pin
- 🔥 Join "Suggested Topics" Campaign & Win a share of $200 Weekly Rewards
👉 How to Join:
1.Visit Gate Post APP page
2.Click any top 3 "Suggested Topics"
3.Users who post quality content under "Suggested Topics" will be selected to win rewards.
Example:
Post content related to trading strategies, ma
- 🎉 Thanksgiving Special: Chat & Win Exclusive Gate.io Merch!
Thanksgiving Exclusive Merch Giveaway!Join the Gate.io Chat Community, chat actively in the community to win exclusive prizes, more futures vouchers, Thanksgiving Lucky Grand Prizes, and tons of red packets waiting for you to grab!
🎁Benef
- 🧧 Join Gate.io Chat Community to grab red packet airdrops everyday!
⏰ Click the red packet icon as soon as the countdown ends. First come, first served.
🔥 Remember to claim your lucky red packet & do not miss out!
Join Gate.io Chat Community:
👉🏻 Open #Gateio# App - Click "Moments" - Find "Chat"
- 📚 #Postopedia# Gate Post Postopedia 4️⃣ is coming!
Expose more Gate Post rules to help you master it!
🧐 What are Gate Post Ambassadors? What exclusive benefits are offered?
Become a ''Gate Post Ambassador'' and enhance your influence! 🚀
Sign up now to easily enjoy exclusive benefits! 🎁
Get invol
- 🔥 $100M in #USDE# Rewards Up for Grabs!
🎁 Hold #USDE# and Enjoy 34% APR, Settled Daily with No Staking Required!
💰 Exclusive Bonus for New Users: 100,000,000 #PEPE# !
👉 Join Now: https://www.gate.io/campaigns/100-m-usde
⏰ Event Duration: Nov 18, 00:00 - Nov 28, 00:00 (UTC)
Details: https://www.g
Follow these indicators: When will the Bitcoin bull end?
Questions have arisen as to when the upward cycle in Bitcoin (BTC), which is running from record to record, will end.
The leading crypto Bitcoin continues to rise with the influence of Donald Trump and spot BTC ETFs traded in the US. BTC gained momentum with Trump's media company's acquisition of the crypto exchange Bakkt. The BTC price reached a record high of 93,905 dollars the other day.
As the bull cycle continues in the crypto market with new investors joining in day by day, investors have started to wonder when a potential downturn will come.
CryptoQuant, a chain data platform, shared five indicators that need to be tracked to understand whether the BTC price is peaking (end of the bull cycle) or not.
It is worth noting that these metrics may not provide definitive results and should not be used as a sole indicator.
MVRV Ratio
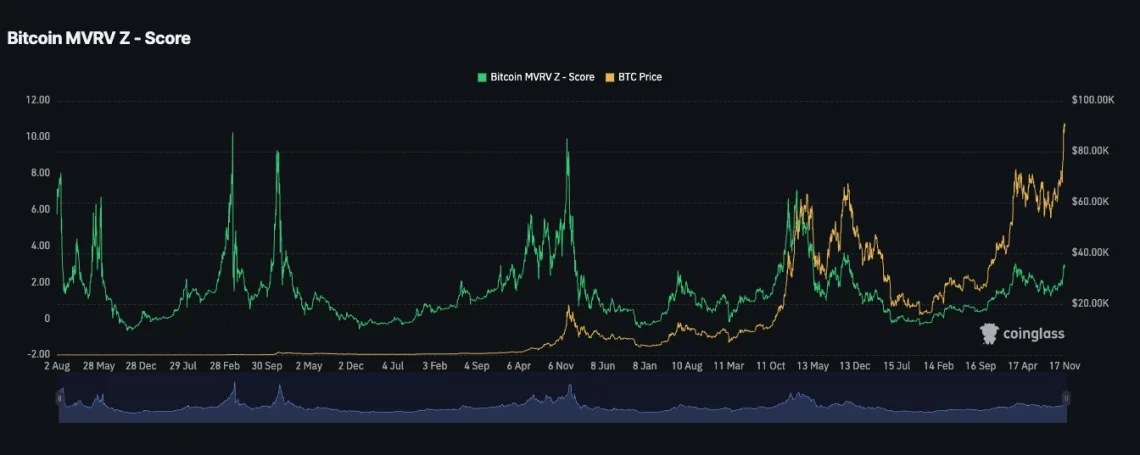
The MVRV Ratio, calculated by dividing Bitcoin's market value by realized value (cost), became one of the metrics to be followed to understand whether the bull cycle is ending or not.
CryptoQuant emphasized that if the MVRV Ratio is above 3.7, the price of BTC will reach its highest level and that point will mark the end of the cycle. Data shows that the MVRV Ratio is at levels of 2.67.
In February 2021, when Bitcoin reached a historic peak of 60,000 dollars, the MVRV Ratio had risen to 7 levels.
Fear and Greed Index
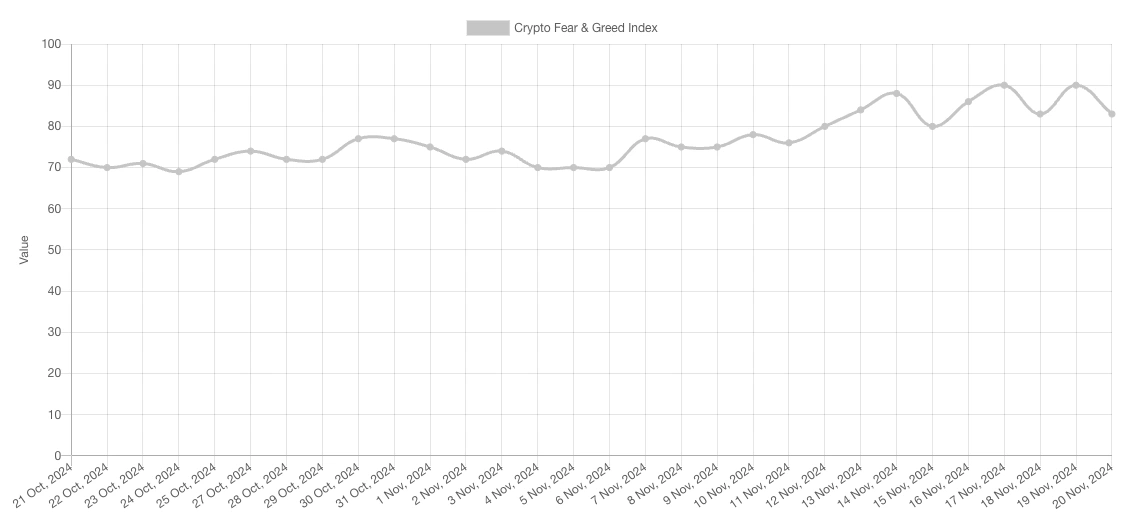
According to CryptoQuant's report, the next indicator to watch is the Fear and Greed Index, which measures market sentiment.
CryptoQuant said that when the index score reaches 80 out of 100, it will mark the end of the BTC bull cycle. The report emphasized that the index alone would not make sense.
The Index has been hovering above 80% since November 12th. The Fear and Greed Index, which reached the 90 levels on November 19th, has reached its highest level since February 2021.
New Money Inflows
In CryptoQuant's report, the third peak prediction indicator was new fund inflows. According to the report, if new fund inflows into the crypto market decrease, the Bitcoin price may have reached its peak. The decrease in this fund flow stops the upward cycle and eventually causes a pullback.
CryptoQuant stated that it is an ideal tool to track how much money is flowing into the market by observing the growth chart of BTC's realized value. The report emphasized that new money inflows are still at higher levels.
Coin Days Destroyed indicator
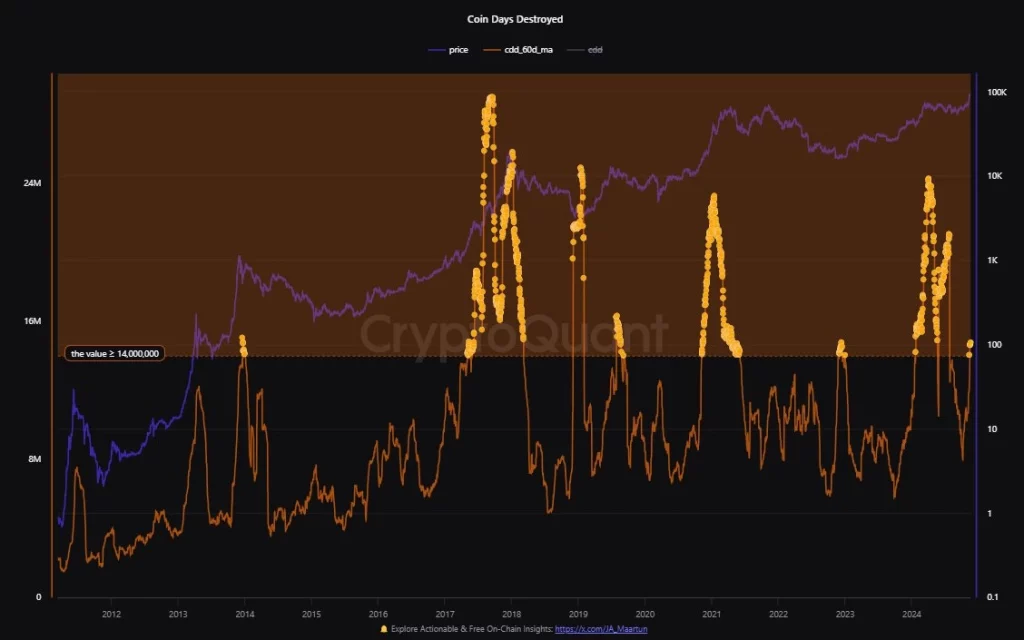
Another indicator in the report was the "Coin Days Destroyed" indicator. The indicator, which evaluates whether long-term BTC owners are actively selling or not, examines the situation of BTCs that have been inactive for a long time.
If the indicator exceeds 15 to 20 million, the BTC price may experience a short-term decline. According to CryptoQuant, the data is currently hovering around 15.1 million.
Inter-Exchange Flow Indicator
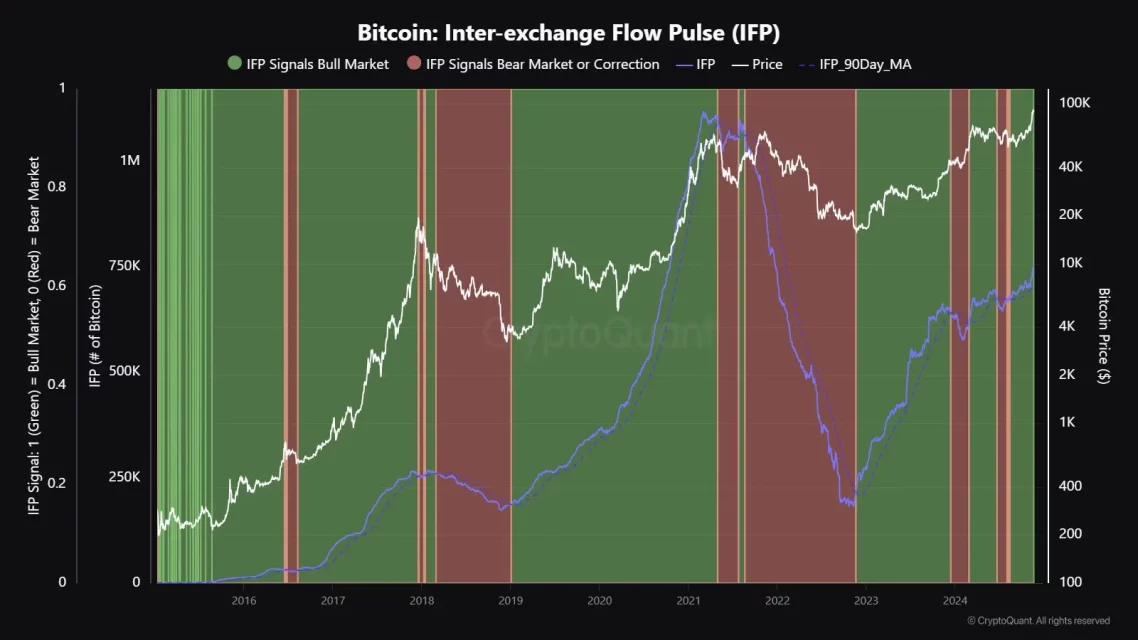
The latest indicator in the report, the Interexchange Flow (IFP) indicator, tracks the entry and exit of Bitcoin to derivative exchanges. This indicator evaluates whether traders are using BTC as collateral.
CryptoQuant emphasized that IFP still forms a bullish structure and traders use BTC as collateral in futures trading. According to the data, BTC continues to be moved to derivative exchanges.
BTC's IFP is currently hovering around 730,000 levels. CryptoQuant reported that during the previous bull cycle, IFP reached 1 million and then dropped to 200,000. BTC reached the peak of the cycle when IFP was at the 1 million level.
This article does not contain investment advice or recommendations. All investment and trading activities involve risks, and readers should conduct their own research when making decisions.