- Topic
101k posts
64k posts
59k posts
56k posts
53k posts
46k posts
44k posts
43k posts
41k posts
- 10#NADA#
40k posts
- Pin
- 📣 Gate.io Post Crypto Observer Call to Action!
📈 Share crypto news & win great rewards daily!
💓 Don't hesitate, join now ⏬
1.Share daily crypto news, market trends, and insights into your post.
2.Include the #CryptoObservers# to successfully participate.
🎁 5 lucky "Crypto Observers" will be rewa
- 📢 #GateOpinionQuest# for #50# is online! DYOR on Ola (OLA), share your opinion on Gate Post, grab a $100 OLA prize pool!
💰 Select 10 lucky participants, win a $10 reward in $OLA each easily!
👉 How to Participate:
1.Research Ola (OLA) and share your opinion on Gate Post.
2.Include Ola (OLA) tradin
- 🔥 Join Gate Post Ambassador Points Task and Win Weekly $200 Rewards (11/11-11/17)!
👉️ Post to earn points and win a share of $200 based on your points, plus ambassador benefits!
👉 Sign up now: https://www.gate.io/questionnaire/5158 (Ends at Nov 11, 16:00 UTC)
🎁 Rewards:
Weekly Ranking Prizes:
🥇
- 🚀 The special episode of "Dr. Han, What Do You Think" is live!
🎙 Gate.io Founder & CEO Dr. Han takes on a rapid fire Q&A, covering work, life, and some truly tricky questions!
👀 How will he tackle these challenges?
🤩 Click to watch his real-time reactions, and join in the comments! - 📢 Gate.io Post Tag Challenge: #MyFavoriteToken# Post and WIN $100!
Have a favorite token you're excited about? Whether it’s for technical innovation, community support, or market potential, join #MyFavoriteToken# event and share your insights with us!
💡 How to Participate:
1️⃣ Follow Gate_Post
2️⃣
Fantom (FTM) whales sounded the alarm: Is the rally at the door?
Chain metrics show that Fantom (FTM) funding rates have reached their highest level of the week and whales are accumulating.
An analysis prepared for FTM gave a bullish signal. The analysis included the following statements;
"The funding rates in Fantom indicate that more investors are taking long positions (upward)".
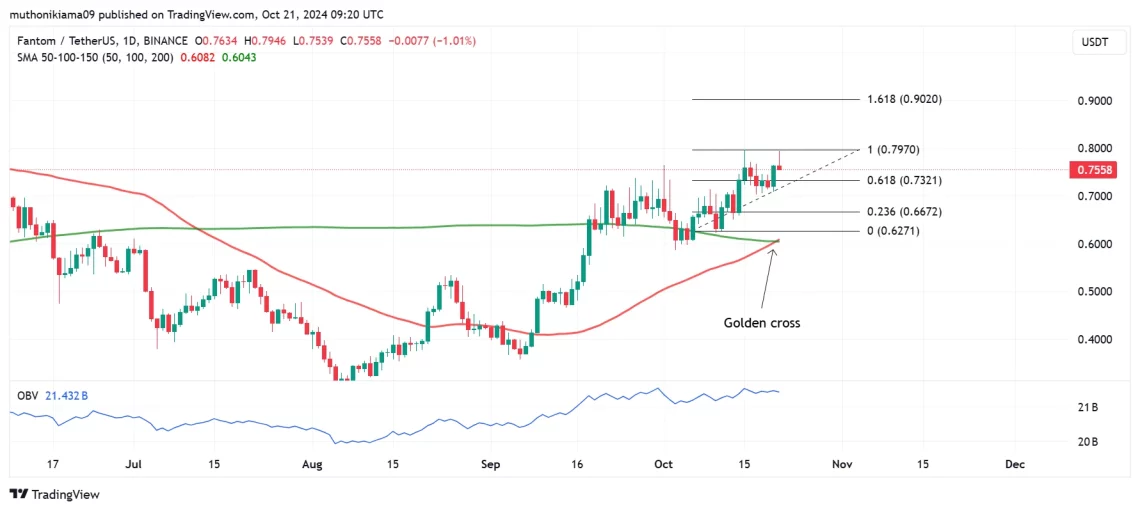
Analysis reported that the 50-day moving average crossed above the 200-day moving average on the FTM chart. This development was interpreted as a bullish signal known as the 'Golden Cross'.
Fantom (FTM) data is positive
The whale transaction volume in Fantom (FTM) has reached its highest level of the year at 201 million. FTM has recorded a growth of over 20% in the last 30 days with increasing investor interest.
Investor interest is increasing in FTM, which is in a gradual uptrend. According to IntoTheBlock data, whales hold 73% of the FTM supply. These whales continue to accumulate with the expectation of a potential rise.
Chain data shows investors are withdrawing FTM from centralized exchanges. AMBCrypto interpreted the data as follows;
"In the last two days, the net flow of FTM on the exchange has been predominantly negative (outflow from the exchange). Outflows from the exchange can alleviate selling pressure. Negative net flows from the exchange indicate that traders are not willing to take profits."
Fantom (FTM) analysis
According to AMBCrypto's analysis, the golden cross formation on Fantom's daily chart indicates that the upward trend will continue.
The golden cross formation also occurred in the volume indicator showing the upward trend. The indicator indicated a gradual increase in buying activity necessary for the sustainability of the rally.
FTM, where the uptrend formation is formed, got stuck at the resistance level of $0.797. The analysis predicted that if the price exceeds the major resistance point of $0.797, it will continue to rise. It was suggested that FTM could reach $0.9.
The analysis included the following statements;
“On the other hand, if buyers have difficulty surpassing the current resistance and the breakout fails, FTM may test the support at $0.732.”
This article does not contain investment advice or recommendations. Every investment and trading activity carries risks, and readers should conduct their own research when making decisions.