Exchange
Promotions
ETH 2.0 Upgrade
ETH’s The Merge has finished
Affiliate Program
Earn commissions by sharing Gate.io with your audience
Influencer Program
Affiliate Starter Edition
Referral Program
Invite your friends for fee disccount and more
Rewards Hub
Complete tasks and win up to $5,000 prizes
Institutional and VIP Services
Services for quant, market makers and brokers
Gate shop
NEW
Exquisite Gate Peripheral Merchandise
No new notifications
More
Rise/fall colour
Start-End Time of the Change
- Topic
79k posts
59k posts
52k posts
50k posts
48k posts
45k posts
43k posts
42k posts
39k posts
37k posts
- Pin
- 🎉 Gate.io Honor Credits Grand Draw Round 3️⃣ is Now Live!
How to Join?
1️⃣ Head to the Gate Post ‘Credits Center’ and complete tasks
2️⃣ Earn Honor Credits and hit ‘Draw Now’ for your chance to win!
➠ Every 500 credits gives you a shot!
🎁 MacBook Air, exclusive merch, and more awesome prizes await!
⏰ Event Time: September 26th 00:00 - October 6th 16:00 (UTC)
Draw Now 👉 https://www.gate.io/activities/creditprize?now_period=3
Learn more: https://www.gate.io/announcements/article/39517
#HonorCredits#
- With cyber threats on the rise, collaboration is key for building adaptable, multi-layered security strategies.
At #Gate.io# , we’re partnering across the industry and innovating to create a safer, stronger blockchain ecosystem together.
Learn more: https://www.gate.io/announcements/article/39567
- ✍️ From keynotes with Dr. Lin Han and AWS to celebrating the momentous ceremony with Inter Gateway to Championships united blockchain and sports!
🚀 We explored the future of #Web3# , had great discussions, and wrapped up with an excellent dinner.
Learn more: https://www.gate.io/announcements/article/39366
#Gateio# #Inter# #Crypto# #GatewayToChampionships# - 🔥 Join Topic Discussion in Gate.io Chat Community & Win Bounty Prizes Every Day 🔥
Participate:
1⃣Join Gateio Chat Community
2⃣Discuss the trending topics presented by the admin
3⃣Stand to be selected & win token prizes every day!
2 - 5 winners, each $5 Points
Join #Gateio# Chat Community:
👉🏻 Open Gate.io App - Click "Moments" - Find "Chat" - Enter " Gate.io Group" or
🔗 Click the link to enter: https://gateio.oneLink.me/LHro/group?chatroom=group
- 🔥 Gate.io Crypto Predictor Campaign will end soon!
Prediction result of Sep 26:
1️⃣ #BOME# 2️⃣ #PEPE# 3️⃣ #WIF#
📈Claim $900 reward now: https://www.gate.io/questionnaire/5145
✔️predict #DOGS# , #HMSTR# ... to win $9,000
✔️Become crypto prediction master to share $1,000
EMC Labs Report: Interest Rate Cut in September Will Reset the Trend of BTC since May+
Written by: 0xWeilan, Source: EMC Labs
The information, opinions and judgments mentioned in this report, including markets, projects, currencies, etc., are for reference only and do not constitute any investment advice.
The encryption asset market after March 2024 seems to be passively falling into a second-rate performance with the theme of 'waiting'. All actors, creators, and producers seem to have forgotten about the plot, scenes, and original theme, just waiting for some 'audience' to get on board, and whether there will be a hurricane tonight.
From mid-March to the end of August, over a span of more than 5 months, the price of BTC has been fluctuating in the 'new high consolidation zone'. During this period, the global market has experienced inflation fluctuations and downturns, ambiguous and clear expectations of a US interest rate cut, speculations about whether there will be a soft landing or hard landing for the economy, as well as intense market volatility triggered by the adjustment of positions by different investors due to trend changes.
In this context, some BTC investors in the crypto market have first major dumping to lock in profits and drain liquidity, during which there are mixed speculative shorting, panic selling, and changes in risk preference caused by market sentiment, leading to Position adjustments between Altcoin and BTC.
This is the essence of the market movements we have observed during this period.
After 5 and a half months of turbulence, the crypto market has entered a downturn period. Spot liquidity has significantly decreased, leverage has been cleared, the rebound is weak, and the rebound price is gradually declining. Investors are sluggish, and a pessimistic and negative sentiment shrouds the crypto market.
This is a result of market movement and also an internal resistance in the next stage. But in our view, the greater resistance lies in the external market - the uncertainty of macro finance, the hidden concerns of a hard landing in the US economy, and the unclear trend of the US equity market.
The internal clearing of the encryption market is coming to an end, and the distribution of Market Cap and long and short positions has entered a state of accumulation, preparing for the upward movement. However, the funds in the market are relatively weak, lacking the confidence and ability to make independent decisions.
URPD: 2.91 million+BTC repricing
Over the past 8 months, the market has been continuously volatile. When we shift our focus to on-chain, we can directly face the orderly results of chaotic movements.
Bit Network URPD (3.13)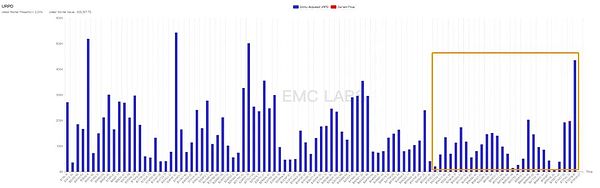
The URPD index is used to describe the statistical analysis of the price of all unspent BTC, which can effectively insight the final result of chip allocation. The chart above shows the BTC distribution structure when BTC hit a historical high on March 13th. At that time, 3.086 million chips were accumulated in the "new high consolidation zone" (53,000 to 74,000 USD). As of August 31st, Closing Price, the chips distributed in this range reached 6.002 million, which means that at least 2.916 million+ BTC have been placed in this range over the past 5 months.
BTC URPD (8.31)
In terms of time, BTC broke through the market from mid-October last year to reach its historical high on March 13, taking more than 5 months to rise. Now, in the 'new high consolidation zone,' the sideways consolidation has also lasted for more than 5 months, with the highest price reaching $72,777 and the lowest price reaching $49,050. There have been more than 7 occurrences of swing trading oscillations. This oscillation has resulted in the exchange of over 2.916 million+ chips (the actual data is much higher than this, and the exchange data of centralized exchanges is not fully reflected on-chain), greatly depleting the market's liquidity.
BTC achieves Market Cap
Through the 'realized Market Cap' based on the purchase cost, we can observe that after the market entered a new high consolidation phase since March, although the price did not further rise, the realized Market Cap is still rising, which means that large-scale cheap chips have been repriced during this period. BTC repriced upwards can be transformed into support or form pressure under specific conditions.
So we maintain a neutral attitude towards the distribution of URPD. There is indeed a sufficient scale of chips to realize the exchange, and a sufficient scale of funds to see a good future market price. However, the nature of these funds is unknown, and whether they will provide support or pressure to the market in the future still needs to be observed.
Long and Short: Big dumping and cooling again
We view market cycles as a major turnover in the time dimension between long-term investors and short-term investors, during which they exchange between BTC and USD.
Long/short position holding statistics (weekly)
BTC launched in mid-October, and large-scale selling began in December, reaching its peak in February and March, driving the market to set new highs during this period before starting to adjust, gradually forming a "new high consolidation zone".
Starting from May, the large-scale reduction of long positions has significantly decreased. This group has restarted their accumulation, and the pace of accumulation has noticeably accelerated in the past seven to eight months, with the group accumulating 630,000 BTC from the lowest point to August 31. Meanwhile, the selling pressure mainly comes from short positions and Miner dumping.
In our June report, we pointed out that there would be two big dumpings in each Bull Market cycle, and the second one would completely drain the market funds and destroy the Bull Market. What has happened in the past few months is only the first wave of dumping. This wave of dumping has lasted for more than 5 months and is nearing its end, as can be clearly seen from the on-chain distribution results.
BTC HODL Waves
HODL Waves shows that the number of new coins in the past three months has rapidly decreased, indicating a significant drop in speculative activities, and the new coins from March to June are also accelerating downward (which is also an important component of the new high consolidation zone). Most of these BTC holders entered the market after the ETF approval and should be considered as 'single-cycle long-term holders'. This means that most of the BTC they hold will be transformed into long-term Holdings, and the sharp increase of 470,000 in long-term Holdings in August is evidence of this. In the foreseeable future, long-term Holdings will continue to rise rapidly.
The cooling of the BTC position structure is the result of BTC's return from short to long in the "new high adjustment period" oscillation. This change will significantly reduce market Liquidity. The decay of Liquidity often pushes the BTC price further down when funds are scarce, and pushes the price up when funds are abundant.
So, we can conclude that after more than 5 months of volatility, the market is ready for the main direction of capital flow (rather than internal chip conversion) to determine PA.
Fund Flow: The Stalled ETF Channel Fund
In the November 2023 report, we mentioned that the flow of funds in the Stable Coin channel turned positive in mid-October, the first time since February 2022, representing the arrival of a new phase. Subsequently, BTC initiated a significant pump.
Main Stablecoins Inflow and Outflow Statistics (Monthly)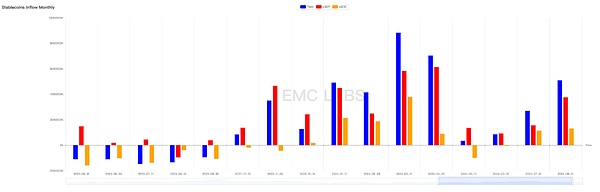
During the past 5 months of adjustment, May and June were the moments when market funds were the most scarce, with only $1.201 billion flowing in during these two months. This pessimistic situation is being reversed, with inflows of $2.696 billion and $5.09 billion in July and August, respectively. The influx of these funds indicates recognition of the price range in the consolidation phase after reaching new highs, and a positive outlook for the mid-to-long term of the bull market's second half.
In January of this year, after the approval of 11 BTC ETFs in the United States, the funds in this channel began to become an important independent force. In previous reports, we have repeatedly pointed out that the funds in this channel have independent willpower and will become an important force in pricing BTC due to their scale and ability to act. In July, during the panic selling caused by the German government's dumping, the funds in the BTC ETF channel decisively attacked and picked up cheap and plentiful chips.
However, as the confirmation of the August US interest rate hike became more certain, the unexpected interest rate hike in the Japanese yen caused fierce Close Position trading by Arbitrage traders, triggering a severe shock in global stock markets and affecting BTC ETF, which is considered a high-risk asset. The continuous dumping by ETF holders at the beginning of the month caused BTC to plummet to $49,000, reaching a new low in months and breaking through the lower boundary of the "new high consolidation zone." Subsequently, ETF channel funds gradually flowed back (stablecoin catch the bottom funds also poured in later), pulling the BTC price back to $64,000. By the end of the month, as ETF channel funds flowed out again, the BTC price pulled back below $60,000.
8th 11th BTC ETF Fund overall fund inflow and outflow statistics (daily)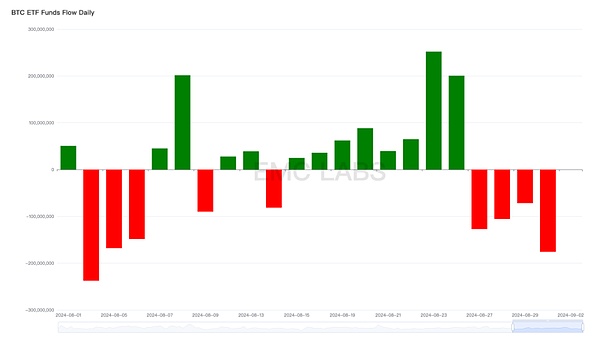
In terms of monthly performance, the BTC ETF channel saw a net outflow of -72.83 million USD this month, marking the second worst month in history, only better than April.
Overall Fund Inflow and Outflow Statistics of 11 BTC ETF Funds (Monthly)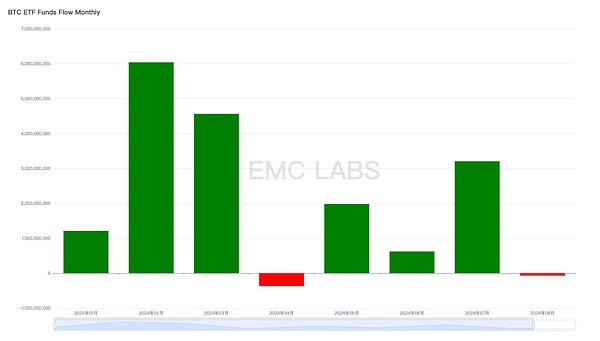
Let's look at the merger of two funds -
Total inflow and outflow of stablecoins and 11 BTC ETF channels (monthly)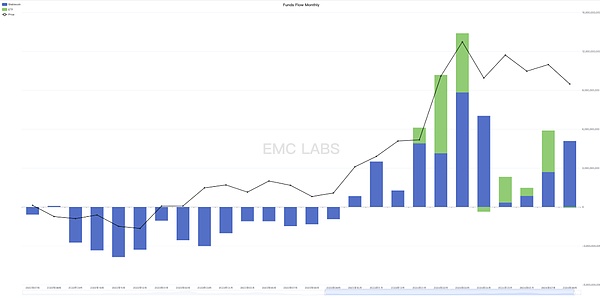
Although stablecoins have recorded inflows for three consecutive months, the ETF channel saw outflows this month, resulting in a total inflow of only $5 billion in August, lower than the $5.9 billion in July. EMC Labs believes that amid a more stable chip distribution, the inflow of funds is the fundamental reason why BTC was able to rebound to $65,000 after the big crash in August. However, the reduced inflow of funds resulted in this month's high of $65,050 being significantly lower than July's $70,000. The decrease in funds is mainly due to the outflow of funds from the ETF channel, dropping from $3.2 billion in July to $72.83 million outflow this month.
The attitude of the BTC ETF channel funds closely connected with the US stock market has become the most critical factor determining the market trend.
September interest rate cut: soft landing vs hard landing
Unlike the weak performance of BTC in August, although it also experienced severe volatility, the US stock market still showed amazing resilience during the same period. The Nasdaq recorded a monthly pump of 0.65%, while the Dow Jones Industrial Average reached a new all-time high. During this period, there has been much discussion about whether the interest rate will be increased by 25 or 50 basis points in September, but the real focus of traders is actually the core issue of whether the US economy will have a soft landing or a hard landing.
According to the current U.S. stock trend analysis, EMC Labs believes that the market as a whole is inclined to the United States economy will achieve soft landing, so it does not price the overall downward price of the U.S. stock market under the expectation of hard landing. Based on the assumption of soft landing, some funds chose to withdraw from the "Big Seven", which had already pumped sharply (most of them underperformed the Nasdaq this month), and entered other Blue-Chip Stocks, which had smaller gains, pushing the Dow Jones to a new all-time high.
Based on past experience, we tend to believe that investors in the US stock market view BTC as a "Seven Giant" asset - although it has a bright future, there is currently a high risk of overvaluation, so there has been a large-scale dumping, which is generally synchronized with the "Seven Giants" dumping. However, relative to mainstream funds, the appeal of the "Seven Giants" is much greater than BTC, so after the big dump, the rebound of the "Seven Giants" is stronger than BTC.
Currently, CME FedWatch shows a 69% probability of a 25 basis point rate cut in September, and a 31% probability of a 50 basis point rate cut.
EMC Labs believes that if the 25 basis point rate cut is settled on September 9th, and there are no major economic and employment data indicating that the economy does not meet the characteristics of a "soft landing," US stocks will run steadily. If the seven giants are repaired upwards, then BTC ETF is likely to resume normal inflows, driving BTC upwards and once again challenging the psychological barrier of $70,000, and even challenging new highs. If there is major economic and employment data indicating that the economy does not meet the characteristics of a "soft landing," US stocks are likely to correct downwards, especially the seven giants. Correspondingly, the BTC ETF channel funds are unlikely to be optimistic, so BTC may decline again and challenge the lower limit of the "new high repair period" at $54,000.
This speculation is based on the assumption that there will be no significant changes in the stablecoin channel funds in September. In addition, we are cautious about stablecoins. Although the channel funds are accumulating, we tend to believe that it is difficult for them to drive BTC out of its independent trend. The most optimistic prediction is that with the background of the seven giants' upward adjustment, stablecoin and ETF channel funds will flow in synchronously to drive BTC upward. If this is the case, breaking the previous high will have a higher probability of success.
Conclusion
BTC broke through $54,000 in January this year, hit a new all-time high in March, and has been consolidating in the "high consolidation zone" in April. It is now May, approaching the end of the sixth consecutive month of increase since September last year, indicating a potential turning point in the trend.
BTC monthly trend chart
This should also be the reason why stablecoin channel funds are gradually gathering to reshape buying power.
However, the real breakthrough still relies on the macro finance and positive US economic core data, as well as the subsequent mainstream funds flowing back into the BTC ETF channel.
As the US dollar enters a rate-cutting cycle, September becomes the most important month of the year, and the US stock market and crypto market will give preliminary answers in this month.