


🔑 Register an account with Gate.io
👨💼 Complete KYC within 24 hours
🎁 Claim Points Rewards
Your Gateway to crypto news and insights
StrategiesforBeginners_web.jpg)
The relative strength index (RSI) measures the magnitude and rate of change of prices of cryptocurrencies.
The RSI indicator fluctuates between 0 and 100, indicating the oversold and overbought market conditions.
The market is oversold if the RSI reading is 70 or above.
Conversely, the market is overbought if the RSI indicator is 30 or below.
The crypto bear market is a period in which many traders struggle to have winning trades because of weak uptrends and prolonged range markets. Nevertheless, traders who use a wide array of technical indicators such as the Relative Strength Index (RSI), MACD and Stochastic indicator can still profit from trading during such periods. In this article, we cover how you can use the relative strength index.
What is the relative Strength Index?
The Relative Strength Index, developed by J. Welles Wilder Jr in 1978, is a momentum indicator. Therefore, it measures the magnitude and the rate of change of prices of different assets including cryptocurrencies.
Wilder discussed the RSI in his book New Concepts in Technical Trading Systems, in which he also explained other key technical indicators which include the Average Directional Index (ADX), Average True Range (ATR), and the Parabolic Stop and Reverse (SAR).
Understanding a momentum indicator
Momentum indicators are technical analysis tools which measure the rate of change of prices of securities. They help traders to determine the strength of short term price movements of tradable assets such as stocks and cryptocurrencies. In most cases, they indicate the overbought and oversold market conditions of the assets.They can also show divergences in price movements.
How does the RSI work?
The RSI indicator is based on 14 candlestick chart periods such as 14 –hours or 14 days and more. Basically, the indicator fluctuates between 0 and 100, indicating the oversold and overbought statuses of the assets. In some instances, the traders can add a middle line, the 50 centerline.
It is fairly simple to calculate the relative strength index since it measures an asset’s gains and losses during a specific period. There is a gain if the most recent closing price is greater than the previous one. To find the average gain we add all the gains for the period and divide by the number of days of the period.
A loss occurs when the most recent closing price is less than the previous one. To find the average loss we add all the negative values (losses) and divide by the number of days for the period.
Finally, we get the relative strength index by dividing the average gain by the average loss.
RSI = (100 – (100 / (1 + RS)))
In this case, RS stands for relative strength. RS has its own formula.
RS = (14 EMA on the last 14 up bars) / (14 EMA on the last 14 down bars)
EMA is an acronym for exponential moving average. It is an average of figures from a defined period where the most recent values are given more prominence or weight than the previous ones.
It is important to note that the traders do not need to calculate the RSI manually. This is because most trading platforms have specific software systems that calculate it. The most important thing for traders is their ability to interpret it.
How to use the RSI indicator
The RSI indicator helps traders in several ways, enabling them to spot trading opportunities.
Bearish and bullish markets
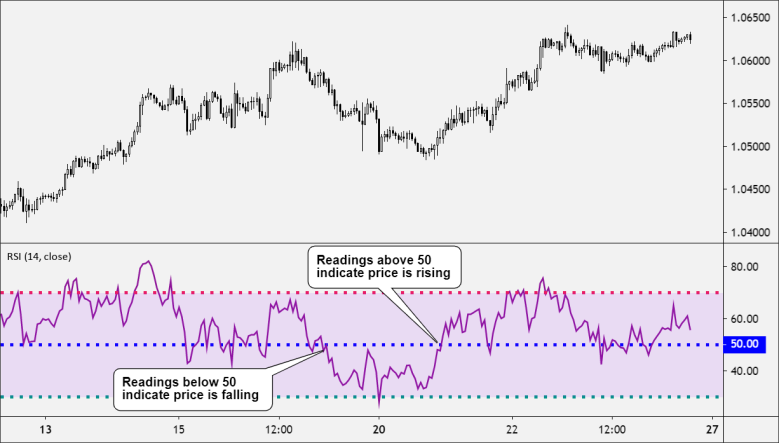
The 50 line enables traders to detect the general bullish and bearish market trends of an asset. If the RSI is above the 50 line, the market is bullish. In the uptrend, the RSI fluctuates between 40 and 90, with the 40 to 50 range acting as the key support zone. As such, the traders should look out for potential buying opportunities.

The 50 centre line- Babyps
When the RSI is below the 50 line, it means that the market is in a new bearish trend. During a downtrend the RSI fluctuates within the 10 to 60 range, while the resistance zone is the 50 to 60 area. In this case, the traders should spot selling opportunities.
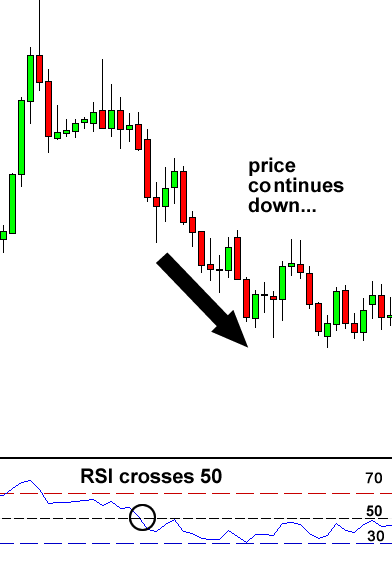
RSI shows a downtrend- Babypips
Overbought and oversold market conditions
As said, the RSI indicator helps traders to identify the overbought and oversold market conditions. Oversold is a state where an asset is overpriced while overbought means that it is underpriced. When the RSI is below 30 the asset is oversold and if it is over 70 it is overbought.
Here is an easy to understand guideline:
0-30: Oversold (OS) area
30-70: Neutral area
70-100: Overbought (OB) area

The overbought and oversold market conditions- Babypips
Bullish failure swing
A buy signal occurs when the RSI crosses below the 30 line and rises above it. After that, it falls back to the 30 line before bouncing up higher than the previous point. This is called a bullish failure swing.
Bullish failure swing- Elearnmarkets
Bearish failure swing
A bearish failure swing occurs when the RSI line rises above the 70 line, then recrosses below it. After that it rises again but fails to cross the 70 line. Finally, it falls below the previous level. In this instance, if there is confirmation from other indicators or price action, the trader can sell the asset.
RSI Divergence
Divergences between the RSI indicator and the price line show potential reversal points. The RSI divergence occurs when the indicator is moving in a different direction from the price.
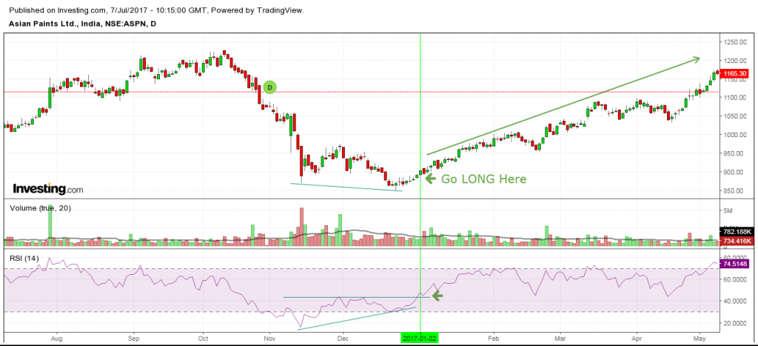
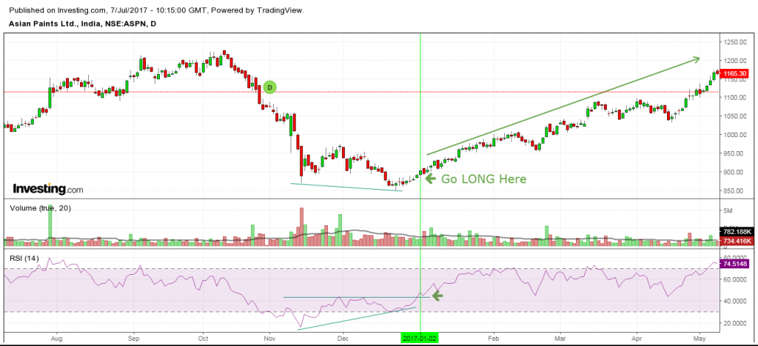
RSI bullish divergence
This takes place when the price is making higher lows while the RSI is registering lower lows. This shows a possibility of short term price gains in the near future. The RSI bullish or positive divergence is a buying signal.
RSI bullish divergence- Igcom
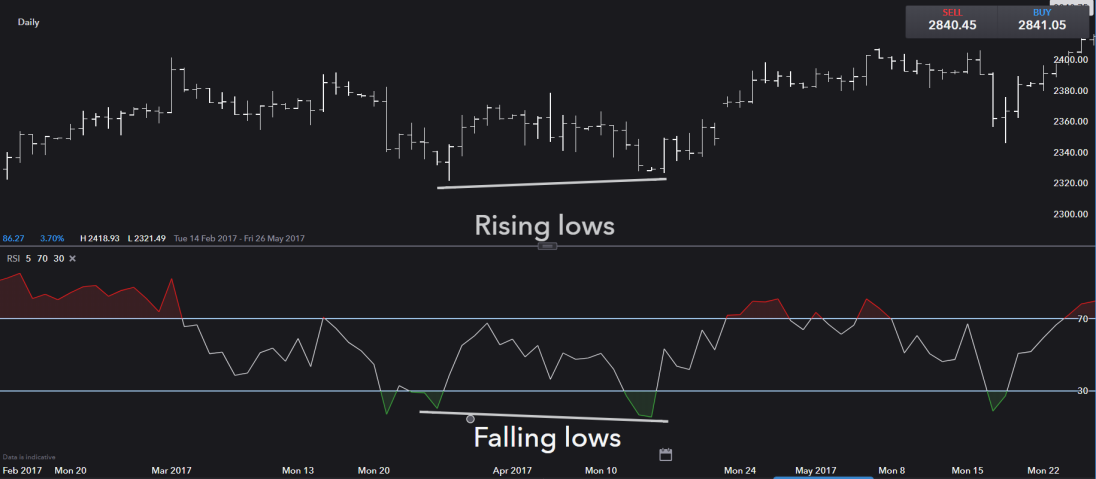
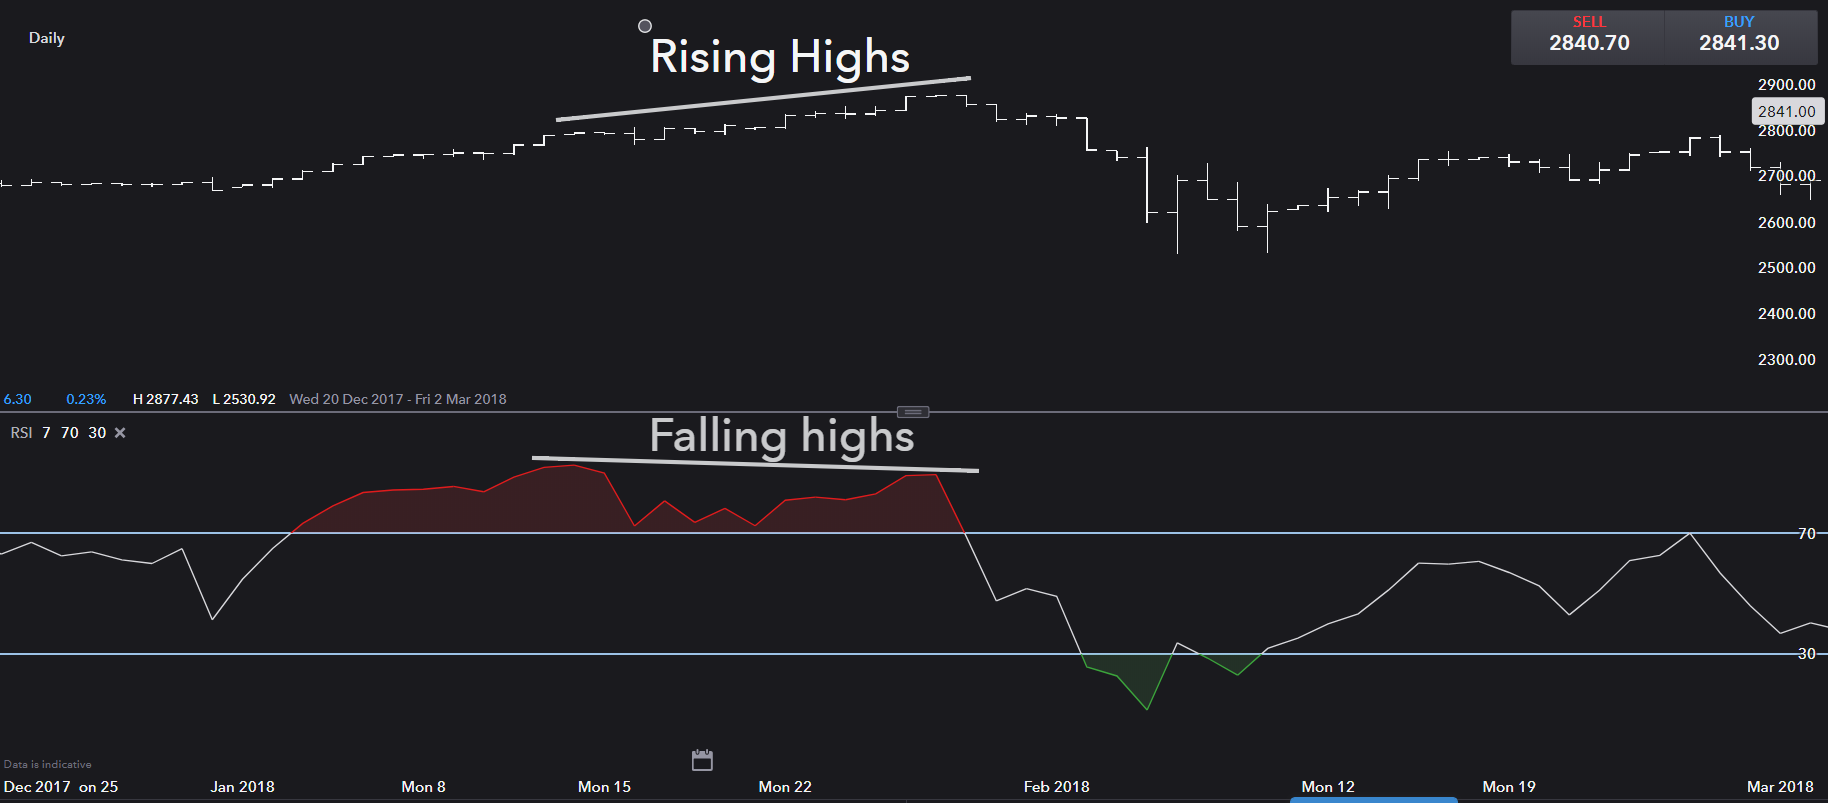
RSI bearish divergence
An RSI bearish divergence, also called negative divergence, occurs when the price is recording higher highs while the RSI is registering higher lows. This usually occurs when the asset is in an overbought zone. The bearish divergence indicates that the asset is likely to have short term price falls. If there is confirmation, traders can sell their securities.

RSI bearish divergence- Igcom
How to use RSI at Gate.io
Most traders at Gate.io combine the RSI indicator with other relevant technical analysis tools to confirm trade entry and exit points. To include the RSI indicator click “RSI” you find below the chart as indicated in the picture.

Once you do this, the RSI appears on the chart.
Conclusion
As we noted, the RSI is a momentum indicator which is reliable if used with other indicators such as MACD and EMA indicator. Traders can use RSI divergences, 70 line and 30 line crosses to identify buying and selling positions. At Gate.io you can use the RSI indicator and other indicators such as the stochastic indicator and Price Channels.
Author: Mashell C., Gate.io Researcher
This article represents only the views of the researcher and does not constitute any investment suggestions.
Gate.io reserves all rights to this article. Reposting of the article will be permitted provided Gate.io is referenced. In all cases, legal action will be taken due to copyright infringement.
🔑 Register an account with Gate.io
👨💼 Complete KYC within 24 hours
🎁 Claim Points Rewards
