Технический паттерн донной рыбалки - двойное дно (W Bottom)
I. Что такое паттерн "Двойное дно"?
Когда цена падает до определенного ценового уровня, объем торгов сокращается, показывая, что никто из трейдеров не желает продолжать продажи, поэтому они размещают стоп-лосс. Затем цена отскакивает под напором покупок, и объем торгов соответственно увеличивается.
Однако рост вскоре столкнулся с давлением продаж, и цена упала во второй раз. Цена снова остановилась, когда упала до уровня, почти равного предыдущему минимуму, а объем торгов сократился и был ниже, чем при предыдущем падении.
В этот момент цена снова выросла, и объем торгов также был значительно больше, чем в первый раз. Этот рост, сумевший превзойти предыдущие максимумы, знаменует собой формирование модели "Двойное дно".
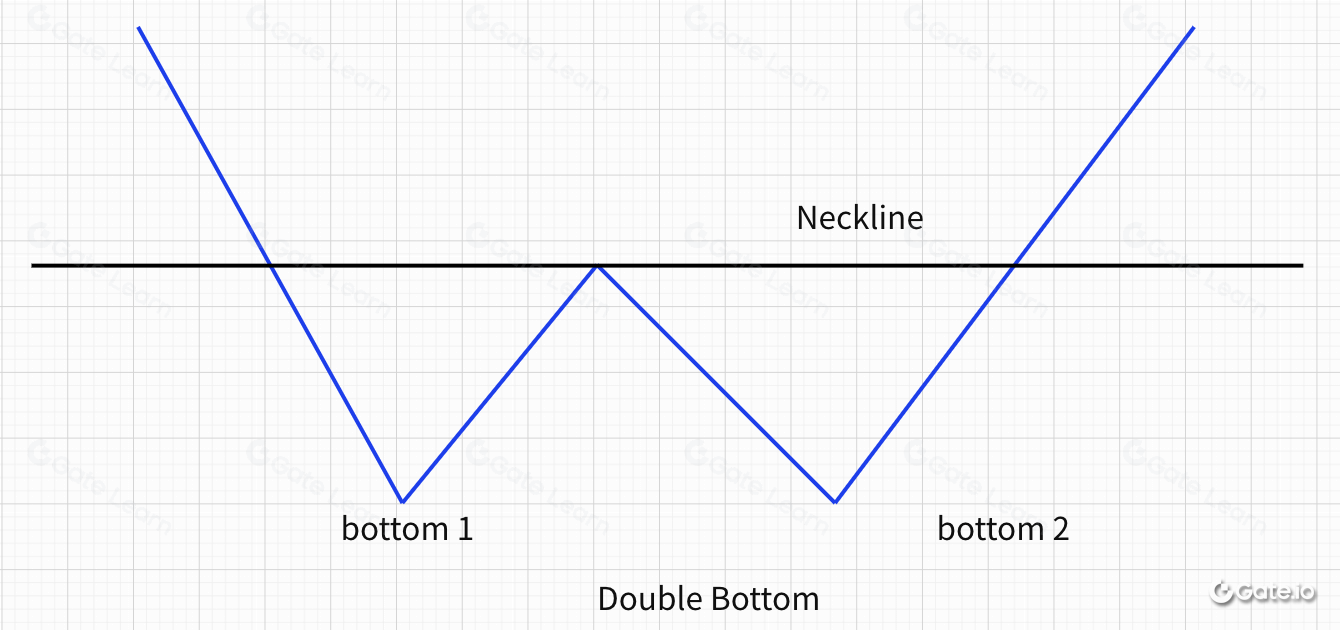
Графически этот технический паттерн имеет две впадины (низшие точки), отсюда и название "Двойное дно". Его также называют W-образным дном, потому что этот узор напоминает форму алфавита "W", как показано на Рис. 8-1.
Горизонтальная линия, проведенная через пиковую точку, является линией шеи двойного дна. Линия шеи является важной разделительной линией для трейдеров при выборе длинной или короткой позиции в паттерне "Двойное дно".
II. Технические характеристики двойного дна
Он появляется в конце нисходящего тренда или среднесрочного корректирующего тренда.
две впадины находятся на одном уровне, или правая немного выше.
В большинстве моделей "Двойное дно" объем торгов на правой впадине меньше, чем на левой, в то время как на втором подъеме объем торгов, как правило, больше, чем на первом отскоке.
Линия шеи двойного дна обычно является горизонтальной линией, проходящей через первый максимум отскока. Иногда она будет слегка наклонена из-за узора.
III. Применение паттерна "Двойное дно
Двойное дно - это модель разворота цены на графике технического анализа, указывающая на то, что цена достигла дна, и являющаяся сигналом к покупке. Конкретное применение подразделяется на следующие случаи.
- Пример реальной торговли
Приведенный выше график представляет собой дневной график SOL/USDT. В период с 2020-9-1 по 2020-11-4, SOL упал с максимума 4,5u до минимума 1,28u, совокупное падение составило 72,8%, а затем началось сильное ралли до 2,4u. Когда он перешел к ловле дна и зафиксировал прибыль, цена снова упала примерно до 1,2u, сформировав двойное дно из всего паттерна. После этого открылась волна бычьего рынка.
- Двойное дно Точка входа 1: когда двойное дно вот-вот сформируется, сделайте еще один шаг назад, чтобы сформировать вторую низкую точку. Затем цены отскакивают, и цена пробивает линию шеи, закрывая положительную линию, которая теперь является точкой входа 1. Это указывает на большую вероятность того, что рынок продолжит расти, как показано на следующем графике:
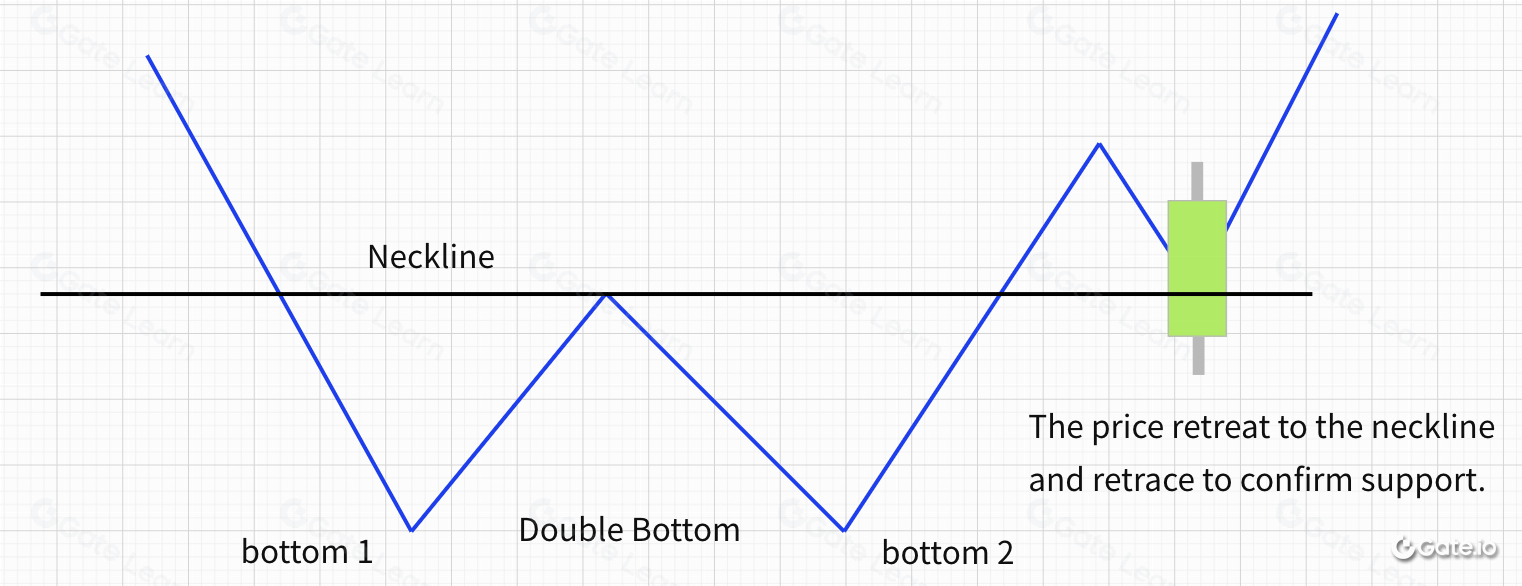
- Точка входа 2 "Двойное дно": когда цена пробивает "линию шеи" и отскакивает к пикам и блокируется, она отступает к уровню "линии шеи" и делает откат для подтверждения поддержки. В этой точке, которая является точкой входа 2, как показано на следующем графике:
- Точка входа 3: Когда цена снова поднимается после отката к линии шеи и пробивает предыдущий ценовой максимум, восходящая К-линия проходит через предыдущий высокий уровень сопротивления, это служит точкой входа 3, как показано на следующем графике:
Наконец, давайте подытожим технику применения "Двойного дна". Сначала проведите линию шеи через отскок от максимума, а затем подтвердите три точки входа в зависимости от того, закроется ли восходящая К-линия положительной.
a. Пробить линию шеи, точка входа 1.
b. Отскок для подтверждения "линии шеи", точка входа 2.
c. Прорыв предыдущего отскока через максимум, точка входа 3.
IV. Неудачи при формировании двойного дна
Даже если сформировалось "Двойное дно", нет гарантии, что последующий подъем будет надежным. Как только цена отступает к уровню поддержки "линии шеи" и формирует следующую падающую К-линию, при этом объект проваливается через "линию шеи", это указывает на медвежий рынок и дает трейдерам сигнал к тому, чтобы идти в короткую позицию, рынок, скорее всего, сформирует нисходящий тренд, как показано на следующем графике:
Краткая информация
Теория Доу - это теоретическая основа технического анализа. если у вас есть прочный теоретический фундамент, вам будет легко изучить технический анализ. Двойное дно также является типичным применением теории Доу с точки зрения работы тренда.
Для получения дополнительной информации о торговле фьючерсами, пожалуйста, посетите фьючерсную платформу Gate.io и нажмите , чтобы зарегистрироваться и начать свое путешествие по торговле фьючерсами.
Отказ от ответственности:
Данная информация предоставляется только в справочных целях. Информация, предоставленная Gate.io выше, не является инвестиционной консультацией и не несет никакой ответственности за любые инвестиции, которые Вы можете сделать. Информация, касающаяся технического анализа, рыночных суждений, торговых советов и обмена мнениями трейдеров, может быть связана с потенциальными рисками, инвестиционными переменными и неопределенностями, и данный выпуск не предоставляет и не подразумевает возможности получения гарантированной прибыли.
Технический паттерн донной рыбалки - двойное дно (W Bottom)
I. Что такое паттерн "Двойное дно"?
II. Технические аспекты "двойного дна"
III. Применение паттерна "Двойное дно"
IV. Неудачи при формировании двойного дна
Резюме
Отказ от ответственности:
I. Что такое паттерн "Двойное дно"?
Когда цена падает до определенного ценового уровня, объем торгов сокращается, показывая, что никто из трейдеров не желает продолжать продажи, поэтому они размещают стоп-лосс. Затем цена отскакивает под напором покупок, и объем торгов соответственно увеличивается.
Однако рост вскоре столкнулся с давлением продаж, и цена упала во второй раз. Цена снова остановилась, когда упала до уровня, почти равного предыдущему минимуму, а объем торгов сократился и был ниже, чем при предыдущем падении.
В этот момент цена снова выросла, и объем торгов также был значительно больше, чем в первый раз. Этот рост, сумевший превзойти предыдущие максимумы, знаменует собой формирование модели "Двойное дно".
Графически этот технический паттерн имеет две впадины (низшие точки), отсюда и название "Двойное дно". Его также называют W-образным дном, потому что этот узор напоминает форму алфавита "W", как показано на Рис. 8-1.
Горизонтальная линия, проведенная через пиковую точку, является линией шеи двойного дна. Линия шеи является важной разделительной линией для трейдеров при выборе длинной или короткой позиции в паттерне "Двойное дно".
II. Технические характеристики двойного дна
Он появляется в конце нисходящего тренда или среднесрочного корректирующего тренда.
две впадины находятся на одном уровне, или правая немного выше.
В большинстве моделей "Двойное дно" объем торгов на правой впадине меньше, чем на левой, в то время как на втором подъеме объем торгов, как правило, больше, чем на первом отскоке.
Линия шеи двойного дна обычно является горизонтальной линией, проходящей через первый максимум отскока. Иногда она будет слегка наклонена из-за узора.
III. Применение паттерна "Двойное дно
Двойное дно - это модель разворота цены на графике технического анализа, указывающая на то, что цена достигла дна, и являющаяся сигналом к покупке. Конкретное применение подразделяется на следующие случаи.
- Пример реальной торговли
Приведенный выше график представляет собой дневной график SOL/USDT. В период с 2020-9-1 по 2020-11-4, SOL упал с максимума 4,5u до минимума 1,28u, совокупное падение составило 72,8%, а затем началось сильное ралли до 2,4u. Когда он перешел к ловле дна и зафиксировал прибыль, цена снова упала примерно до 1,2u, сформировав двойное дно из всего паттерна. После этого открылась волна бычьего рынка.
- Двойное дно Точка входа 1: когда двойное дно вот-вот сформируется, сделайте еще один шаг назад, чтобы сформировать вторую низкую точку. Затем цены отскакивают, и цена пробивает линию шеи, закрывая положительную линию, которая теперь является точкой входа 1. Это указывает на большую вероятность того, что рынок продолжит расти, как показано на следующем графике:
- Точка входа 2 "Двойное дно": когда цена пробивает "линию шеи" и отскакивает к пикам и блокируется, она отступает к уровню "линии шеи" и делает откат для подтверждения поддержки. В этой точке, которая является точкой входа 2, как показано на следующем графике:
- Точка входа 3: Когда цена снова поднимается после отката к линии шеи и пробивает предыдущий ценовой максимум, восходящая К-линия проходит через предыдущий высокий уровень сопротивления, это служит точкой входа 3, как показано на следующем графике:
Наконец, давайте подытожим технику применения "Двойного дна". Сначала проведите линию шеи через отскок от максимума, а затем подтвердите три точки входа в зависимости от того, закроется ли восходящая К-линия положительной.
a. Пробить линию шеи, точка входа 1.
b. Отскок для подтверждения "линии шеи", точка входа 2.
c. Прорыв предыдущего отскока через максимум, точка входа 3.
IV. Неудачи при формировании двойного дна
Даже если сформировалось "Двойное дно", нет гарантии, что последующий подъем будет надежным. Как только цена отступает к уровню поддержки "линии шеи" и формирует следующую падающую К-линию, при этом объект проваливается через "линию шеи", это указывает на медвежий рынок и дает трейдерам сигнал к тому, чтобы идти в короткую позицию, рынок, скорее всего, сформирует нисходящий тренд, как показано на следующем графике:
Краткая информация
Теория Доу - это теоретическая основа технического анализа. если у вас есть прочный теоретический фундамент, вам будет легко изучить технический анализ. Двойное дно также является типичным применением теории Доу с точки зрения работы тренда.
Для получения дополнительной информации о торговле фьючерсами, пожалуйста, посетите фьючерсную платформу Gate.io и нажмите , чтобы зарегистрироваться и начать свое путешествие по торговле фьючерсами.
Отказ от ответственности:
Данная информация предоставляется только в справочных целях. Информация, предоставленная Gate.io выше, не является инвестиционной консультацией и не несет никакой ответственности за любые инвестиции, которые Вы можете сделать. Информация, касающаяся технического анализа, рыночных суждений, торговых советов и обмена мнениями трейдеров, может быть связана с потенциальными рисками, инвестиционными переменными и неопределенностями, и данный выпуск не предоставляет и не подразумевает возможности получения гарантированной прибыли.


